Every claims technology vendor promises faster cycle times and lower leakage. Very few say how they measure them. A measure with no written definition is a number somebody chose. This post lists the measures we think tell you whether a claims desk got better, and how InsightCW reads each from its own ledger.
Five measures
| Measure | Definition | Read from |
|---|---|---|
| Cycle time | Days open to close for claims closed in the last 12 months, by line, severity or owner: bands, median and 90th percentile | Claim status history |
| LAE | Expense paid against indemnity paid, by line, against the line's usual ratio | Payments by type |
| Leakage indicators | Late notice, stair-stepped reserves, held or duplicate payments, expense ahead of the line's ratio, paid well past the first reserve, open past a year, reopens, recovery not pursued | The ledger, clocks and recoveries |
| Reserve accuracy | By accident year: incurred 90 days after report against incurred now | Reserve ledger balances over time |
| SLA hit rate | Clocks met against clocks started, by clock, statutory first | Service clocks |
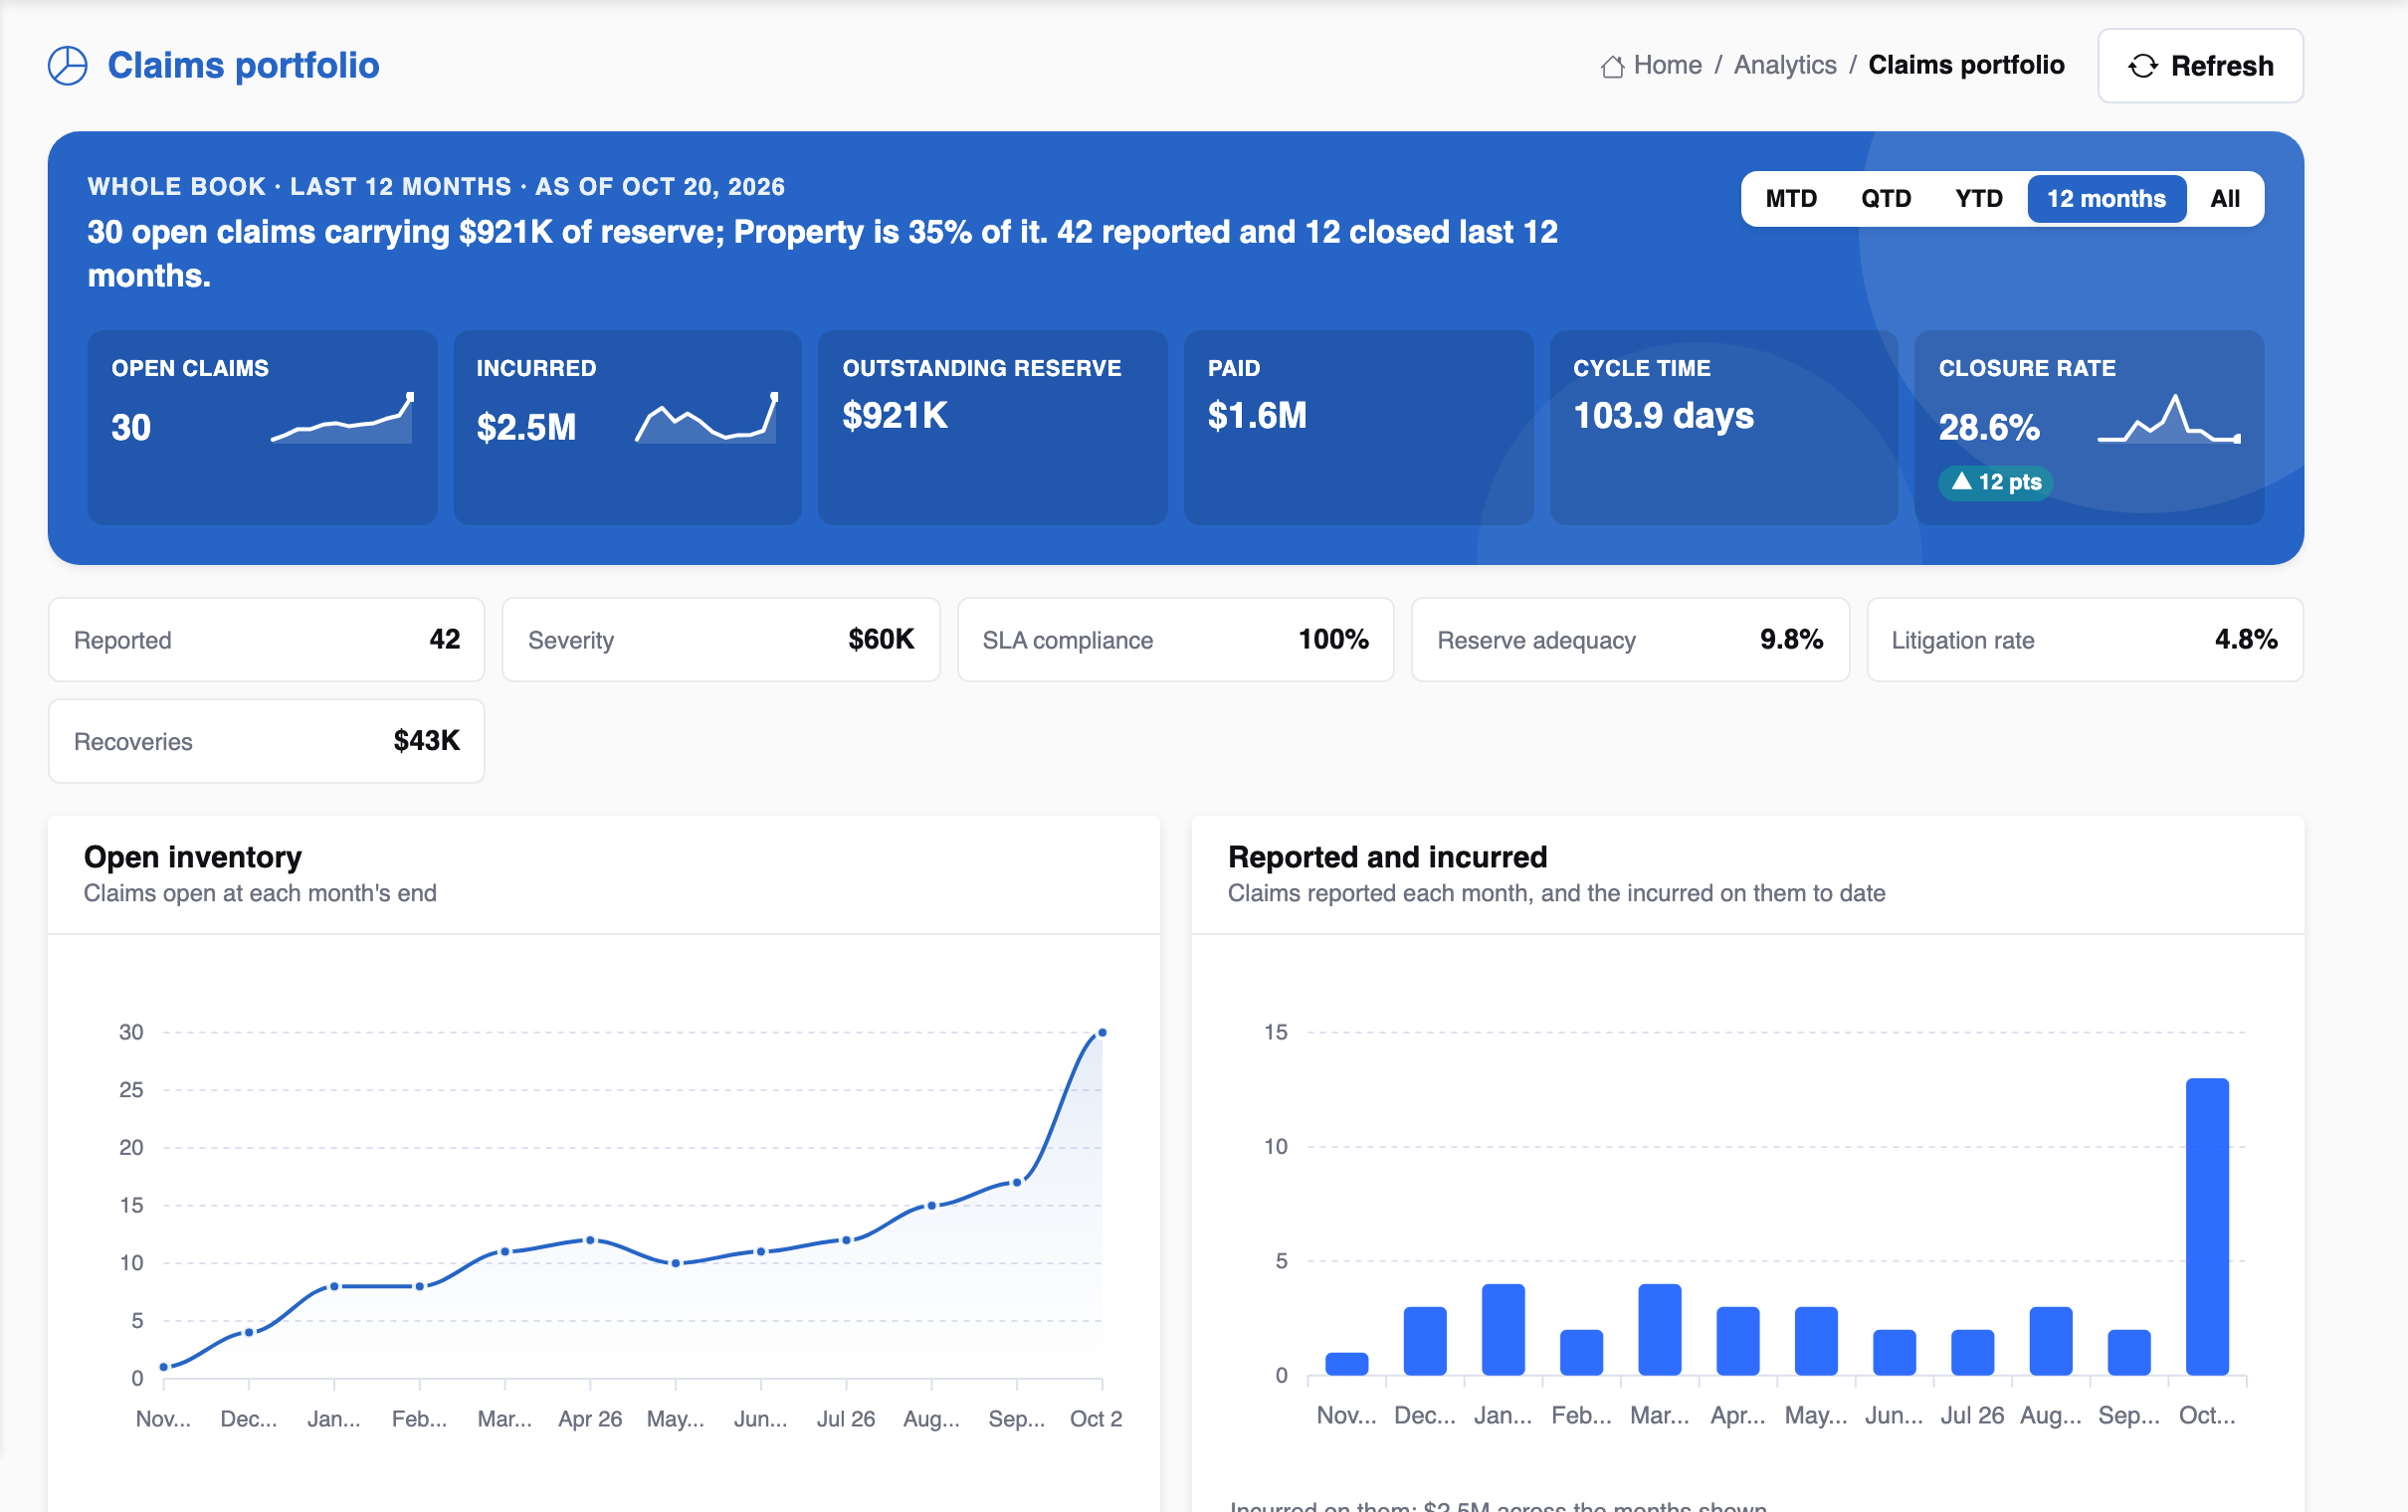
Every figure on InsightCW's analytics page says its basis, and the measures are registered on the platform's metrics layer, so a definition reads the same on the portfolio as on the analytics page. The population is always the caller's book.
Loss development, from your own ledger
The analytics page builds a loss triangle — accident period by age — on paid, incurred or reported count, with volume-weighted age-to-age factors and their product to the last age. It is CW's own development, not an actuarial selection, and it is labelled that way. For actuaries, InsightCW exports one row per claim with accident period, age and paid and case by type.
payment and recovery,
with balance after"] --> B["Measures, defined once
on the metrics layer"] B --> C["Analytics page"] B --> D["Portfolio"] B --> E["Adjuster view"] style B fill:#efeafe,stroke:#7c6cf0
How to compare before and after
- Same desk, same line, same season where you can; claims mix changes everything.
- Medians and 90th percentiles, not averages; one large loss moves an average.
- Count the agents' effect separately. The agent activity page shows which decisions were prepared by an agent and how people answered. A measure that improves on the desk using the agents and not on the one that is not is evidence; a measure that improves on both is the season.
Numbers we do not publish
We do not publish customer improvement percentages on this site. The only numbers worth having are yours, defined as above and measured the same way every month.